Revenue Curves Under Perfect competition
Revenue curve under perfect competition class 11 notes gives a wholesome understanding of the concept. The Average Revenue and Marginal Revenue curves of a firm majorly represent the revenue curve of a firm. These curves show the behaviour of the revenue of a firm. Let us see how the revenue curve of a firm behaves under perfect competition
- What is perfect competition
- Average Revenue & Marginal Revenue Curves under Perfect Competition
- Total Revenue Curve Under Perfect Competition
What is Perfect Competition?
Perfect competition refers to a market situation where there are a very large number of buyers and sellers who deal in identical products. Under perfect competition, the price of the commodity is fixed by the market. There are a huge number of sellers selling identical products. Therefore a single producer cannot influence the price by changing the output level. Thus, the firms are called price takers. They have no market control and receive the market price for their output.
Average Revenue & Marginal Revenue Curves under Perfect Competition
In perfect competition, a firm has to accept the same price determined by the industry. The firm can sell any quantity of a commodity at that particular price. Therefore, it can be said that the price remains constant. When the price remains the same at every level of output, no firm can influence the price. This means that the revenue from every additional unit (MR) equals AR. We also know that AR is equal to price since,
TR = Quantity × Price
AR = TR/Quantity = × Price/
Therefore, AR = Price
As a result, both AR and MR curves coincide in a horizontal straight line parallel to the x-axis.
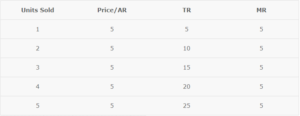
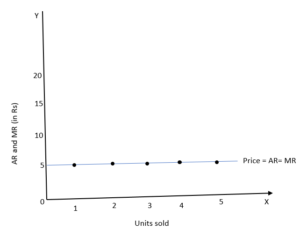
As seen in the given schedule and diagram, price or AR remains constant at all output levels and is equal to MR. As a result, the AR curve is perfectly elastic. This means a firm can sell any quantity of output at a constant price.
Total Revenue Curve Under Perfect Competition
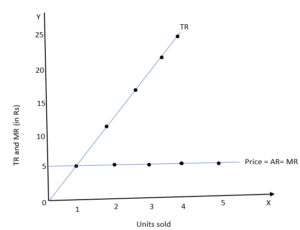
When the price remains constant, firms can sell any quantity of output at the given price. As a result, the MR or AR curve is a horizontal straight line parallel to the x-axis. Since MR remains constant, TR also increases at a constant rate. Due to this, the TR curve is a positively sloped straight line. As TR is zero at the zero level of output, the TR curve starts from the origin.
Revenue curves under perfect competition class 11 notes are presented in this post for easy access to the students. By taking these notes, you can stay active and engaged throughout your reading, revision, and lectures. They also help with clear thinking and understanding. Choose the most important ideas to focus on. These notes provide a useful record of important information and its sources. You’ll be able to recall better what you heard with these notes.
Revenue
- What is Revenue
- Revenue curve under perfect competition