Correlation Class 11 notes are available for students readily. They force you to pay attention to the chapter’s subject matter and make you easily understand the concepts. These notes facilitate easy revision and keep the information at your fingertips. Correlation Class 11 notes are helpful for students as they are short and to the point, which helps you to learn and summarise your learning.
Meaning of correlation under Correlation Class 11 notes
- A statistical tool that examines the relationship between two variables, such as whether a change in price changes the quantity demanded, is called correlation.
- The direction and strength/degree of the relationship between variables are studied and measured through correlation.
- It usually measures the Covariance, not the cause but the degree of the cause. It doesn’t give a sense of cause and effect relationship between the two variables.
Degree of Correlation
| Degree | Positive | Negative |
| Perfect correlation | +1 | -1 |
| High correlation | 0.75 – 1 | -0.75 – (-1) |
| Moderator correlation | 2.5 – 7.5 | -2.5 – (-7.5) |
| Low correlation | 0 – 2.5 | 0 – (-2.5) |
| Zero correlation | 0 | 0 |
Methods of estimating correlation under Correlation Class 11 notes
According to Correlation Class 11 notes, there are three methods of estimating correlation;
- Scatter diagram
- Karl Pearson’s coefficient of correlation
- Spearman’s rank correlation.
Scatter diagram under Correlation Class 11 notes
- A scatter diagram depicts the direction and degree of correlation graphically. A scatter diagram is created by putting the x and y variables on the X and Y axes, respectively.
- A scatter diagram is a plotted collection of points. This enables us to examine the relationship because of the degree of proximity of scatter points and their overall direction.
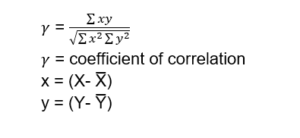
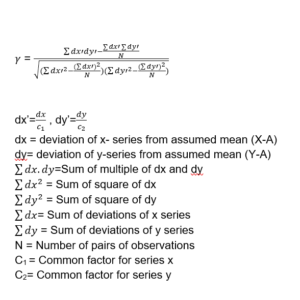
Karl Pearson’s Method
- A quantitative approach to determining correlation is Karl Pearson’s coefficient of correlation.
- The degree to which two variables have a linear relationship is precisely calculated by this method.
- Product moment correlation is another name for Karl Pearson’s coefficient of correlation.
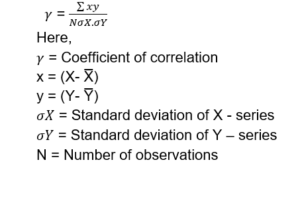
1.Actual mean
2.Assumed mean method
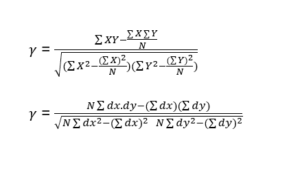
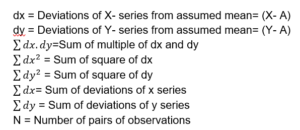
3.Step deviation
Assumptions of coefficient of correlation under Correlation Class 11 notes
- Relationship: Linear If the paired observations of both variables are plotted on a scatter diagram, this method assumes that there is a linear relationship between the variables, which means that the plotted points will form a straight line.
- Relationship of Cause: There is no correlation between the two variables under investigation. However, the forces influencing the two variables are linked by a cause-and-effect relationship. Without a relationship, correlation has no meaning.
- Normal Distribution: A large number of independent causes with a normal distribution have an impact on the two variables under investigation. Variables like height, weight, skin colour, commodity prices, demand, and supply, among others, are influenced by a variety of forces.
- Measurement Error: If the measurement error is kept to a minimum, the coefficient of correlation is more reliable.
MERITS AND DEMERITS OF COEFFICIENT OF CORRELATION
Karl Pearson’s method has the following advantages:
- Popular Approach: It is the mathematical approach to analyzing correlation between two variables that receives the most attention and is utilized the most.
- Correlation’s degree and direction: The direction, or whether correlation is positive or negative, as well as the degree of correlation are both summarized in one figure by the correlation coefficient.
The main drawbacks of Karl Pearson’s method are as follows:
- Extreme values affect: Extreme item values have an undue impact on correlation values.
- Method that Takes Time: It takes longer to complete than other methods.
- The linear relationship is assumed: Regardless of whether or not that assumption is correct, the correlation coefficient always assumes a linear relationship.
- Risk of erroneous interpretation: Because the value of the coefficient of correlation is frequently misinterpreted, one must exercise extreme caution when interpreting it.
Spearman’s Rank Method
- The correlation coefficient of qualitative variables like beauty, bravery, wisdom, ability, virtue, and so on is calculated using Spearman’s rank correlation method.
- E. spearman, a British psychologist, developed it.
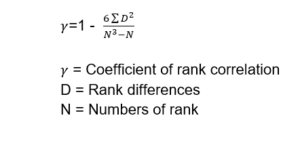
Calculating Rank Correlation under Correlation Class 11 notes
- When ranks are given
Step 1- Present the ranks of the first variable as R1 and of the second variable as R2.
Step 2- Take the difference of the two ranks and denote these differences by D.
Step 3- Compute the squares of these differences and total them to get a sigma D square.
Step 4. Apply the following formula:
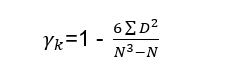
- When ranks are not given
Step 1- Assign 1st rank to the highest (lowest) value, and rank to the next highest (lowest) item and so on.
Step 2- Calculate difference of ranks (R1 – R2);
Step 3- Denote these difference by D;
Step 4- Squares these differences to get sigma D square.
Step 5. Apply the following formula:
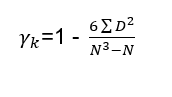
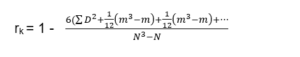
- When ranks are equal or repeated
When two or more than two items of a group have the same value, then they are assigned a common rank.
This common rank is the average of the ranks which these items would have got had they differed slightly from each other.
For example: If two individuals are ranked equal at 3rd place, then each of them are given 3 + 4 / 2 =3.54 rank.
If three individuals are ranked equal at 3rd place, then each of them are given 3 +4+5 /3 =4th Rank.
- The correction factor is to be added for each and every repeated value.
- The formula in this case becomes:
Properties of correlation coefficient(r)
According to Correlation Class 11 notes, the properties of the Correlation coefficient are;
- There is no unit for the correlation coefficient (r).
- A negative value of r indicates an inverse relationship.
- Two variables move in the same direction if r is positive.
- If r is zero, there is no correlation between the two variables. (iv) The value of r falls within the minus – 1 to +1.
- The correlation is perfect if r = + 1 or – 1.
- A strong linear relationship is indicated by a high value of r, while a low value of or indicates a weak one.
- The change in scale and origin do not affect the value of r.
Conclusion
Correlation Class 11 notes are helpful and reader-friendly for the students. These notes are very beneficial as they are updated according to the latest syllabus and provide a clear understanding of every concept. These notes give the students formulae of various methods of estimating correlation and explain the concept with the help of graphs. The notes are put to an end by giving the properties of coefficient Correlation. Thus, they are a must-read before exams.