Measures of Central Tendency class 11 notes are presented in this post. These notes give a wholesome definition of what Positive and normative economics in economics are. These notes enhance concentration and attention to detail. Actively encourages learning. Improves retention and comprehension. Teaches how to prioritize. Increases capacity for focus. Enhances organizational abilities. Enhances imagination. As a result, they offer an opportunity to comprehend and summarise the ideas.
- Central Tendency
- Arithmetic Mean
- Median
- Quartiles
- Percentile
- Mode
- Relative Position of Mean, Mode, and Median
Central Tendency
A central value or representative value of a statistical series is referred to as a central tendency.
“An average is a figure that represents the whole group,” says Clark.
Types of Statistical Averages under Measures of Central Tendency
There are two categories of Averages;
- Mathematical Average
- Positional Average
Arithmetic Mean under Measures of Central Tendency
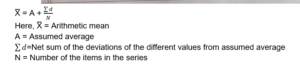
The number that is obtained by dividing the sum of the values of each item in a series by the number of items is called the arithmetic mean.
- The arithmetic mean is typically written as X, but it can also be expressed using the formula below.

Types of Arithmetic Mean under Measures of Central Tendency
- Simple arithmetic mean
- Weighted arithmetic mean
Properties of Arithmetic Mean
- ∑(X – Mean) = 0 indicates that the sum of the observations’ deviations from their arithmetic mean is always zero. The reason for this is that the sum of positive and negative deviations from the mean equals the sum of the arithmetic mean. The arithmetic mean is referred to as the centre of gravity because of this property.
- The items’ squared deviations from their arithmetic mean are minimum, or ∑(X – Mean). is very low. The total is lower than the square of the items’ deviations from any other value.
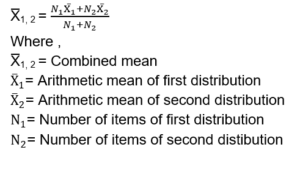
- Mean of the series as a whole: We can calculate the series’s combined means if we have the arithmetic mean and number of items for at least two related groups.
- The arithmetic mean of a new series is X – k if each observation in the previous series is increased or decreased by a constant, such as k. For instance, the arithmetic mean of four items is 7: 3, 5, 8, 12. The new mean, which is 9 if 2 is added to each of the four items, will also increase by 2 on the new four items (five, seven, and fourteen).
- The mean of these observations is also multiplied or divided by a constant when all of the items in a series are multiplied or divided by that constant. The arithmetic mean of four items, for instance (three, five, and twelve), is 7. The new mean, which is 35 if each item is multiplied by, say, 5, will also become five times the original mean for the new four items (15, 25, 40, 60).
- The following formula can be used to determine the combined mean when the number of items and arithmetic means of two or more distributions are provided:

Methods of calculating Simple Arithmetic Mean
Individual Series
Arithmetic Mean can be calculated by two methods under Individual Series;
- Direct Method

- Short-cut Method
Discrete Series
Arithmetic Mean can be calculated by three methods under Discrete Series;
- Direct Method
According to this method, we find the Arithmetic mean from the following formula;
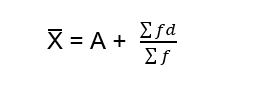
- Short-cut Method
By the shortcut method, we find the Arithmetic Mean from the following formula;
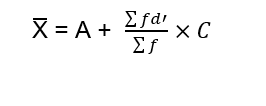
- Step-deviation Method
A variation of the shortcut method is this one. It is used when there is a common factor between deviations from the assumed mean.

Frequency Distribution
Arithmetic Mean can be calculated by three methods under frequency Distribution Series;
- Direct Method
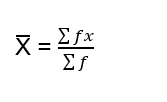
The direct method of estimating the mean of the discrete frequency series uses the formula
- Short-cut Method
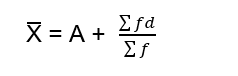
Short cut method of estimating the mean of the frequency distribution uses the formula
- Step Deviation Method
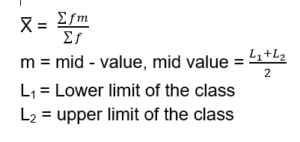
According to this method, we find the Arithmetic Mean by the following formula
Weighted Arithmetic Mean under Measures of Central Tendency
The weighted arithmetic mean is the mean of the series’ weighted items. Depending on their relative importance, different items receive different weights. Divide the weighted sum of the items by the weighted sum.
Weighted Mean Calculation
In this manner, we derive the weighted mean from the following data:

Combined mean
The following formula can be used to determine the combined mean when the number of items and arithmetic means of two or more distributions are provided:
Corrected Mean
At times, due to mistake or oversight, certain wrong items may be taken while calculating the arithmetic mean. In such a case, we can directly calculate the correct arithmetic mean, while calculating the arithmetic mean from the beginning.
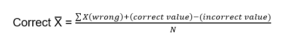
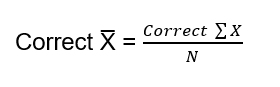
Steps to Calculate Correct Arithmetic Mean
The steps involved in calculating correct arithmetic mean (X) are:
- First of all, Incorrect sigma mean is calculated.

- From this Incorrect mean, subtract wrong or incorrect items and add correct items to get
Correct it.
- Divide Correct mean by the number of items (N) to get Correct X.
Merits and demerits of mean
- Easy to Understand and Calculate: A basic understanding of addition, multiplication, and division of numbers is required for the arithmetic mean calculation. As a result, the arithmetic mean can be calculated by anyone with basic knowledge. The meaning of arithmetic mean, such as cost per unit or item value, is also easy to comprehend.
- Certainty: An algebraic formula provides a firm definition of the arithmetic mean. As a result, every person who calculates the average gets the same result. Personal or deliberate bias is out of the question when using the arithmetic mean.
- Based on everything: All values are taken into account when computing the arithmetic mean. As a result, it is thought to be a better representation of the distribution.
- Least affected by sample variation: The arithmetic mean is the average that is most affected by sampling fluctuations. The arithmetic mean provides a useful basis for comparison when the number of items in a series is large because abnormalities (errors) in one direction are contrasted with abnormalities in another direction. The arithmetic average is thought to be a reliable measure for this reason.
- Convenient Way to Compare: The arithmetic average is a simple way to compare two or more distributions.
- Treatment in algebra: The algebraic treatment of the arithmetic mean can be extended. Because it can be mathematically manipulated, it is frequently used to calculate other statistical measures like mean deviation, standard deviation, and others.
- No arrangement is necessary: The arrangement or grouping of items is not necessary for the arithmetic mean to be calculated.
The disadvantages of arithmetic mean include:
- Extreme values affect: Extreme values (i.e., very small or very large items) have a negative impact on the arithmetic average because it is calculated from all series items. For instance, suppose four people have a 5,000 monthly income; 7,000; 8,000; and one million, their anthmetic mean will be 30,000, which does not accurately reflect the data.
- In the case of open-end classes, assumption: The arithmetic mean for open-end classes cannot be calculated without making assumptions about the magnitude of open-end class intervals.
- Absurd outcomes: If we have an average of 3.2 children per family in a particular community, the result (average) is obviously absurd due to the fact that a child cannot be divided into fractions. The arithmetic mean sometimes yields results that appear almost absurd.
- In the case of qualitative characteristics, this is impossible: For qualitative data, it is impossible to calculate the arithmetic mean; like information about honesty, intelligence, smoking, etc. In such instances, the median—more on that in a moment—is the only acceptable average.
- Putting more emphasis on high-value items: The arithmetic mean has an upward bias because it gives more weight to series items that are higher than smaller ones. The big item will significantly raise the average if, out of five items, four are small and one is quite large. However, this is not the case. The arithmetic average will not be significantly affected if, in a series of five items, four have large values and one has small values.
- Complete data is required: Without all of the items in a series, it is impossible to calculate the arithmetic mean. For instance, the arithmetic average cannot be calculated if, out of a total of 1,000 items, only 999 are known to have values. Complete data are not required for other averages like the median and mode.
- Observational calculations are not feasible: Like median and mode, the arithmetic mean cannot be calculated by simply observing the series.
- The graph isn’t used: The graph cannot be used to calculate the arithmetic mean.
Median under Measures of Central Tendency
“The value of the variable known as the median divides the group into two equal parts; one part contains all values that are greater than the median value, and the other part contains all values that are smaller than the median value.”
Calculation of Median
- Individual Series
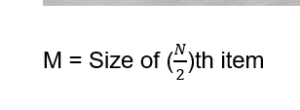
Calculation of the Median in individual series can be done with the following formula;
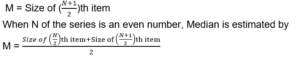
2. Discrete Series
Calculation of the Median in discrete series can be done with the following formula;

3.Frequency Distribution Series
Calculation of the Median in discrete series can be done with the following formula;
Median’s Advantages
- A straightforward central tendency measure
- Extreme observations do not have an effect on it.
- Possible despite insufficient data.
- The data can be presented graphically to determine the median.
- It is worth something.
- It is easy to calculate and comprehend.
- It is not a calculated value but rather a positional value.
Disadvantages of median under Measures of Central Tendency
- Because it shows the value of the middle items, it is not based on all of the series’ items.
- Unsuitable for use in algebraic analysis.
- It takes a long time to arrange the data in ascending order.
- Influenced by item variations.
- The precise location of an even number in a series cannot be calculated.
The location of the Median on the Graph under Measures of Central Tendency
Plotting points from the cumulative frequency distribution and connecting them with a smooth curve creates the ogive curve.
- Using the “Less than” or “More than” ogives method, a frequency distribution series is first transformed into a “less than” or “more than” cumulative series. Data are then graphically presented to create a “less than” or “more than” ogive; N/2 of the series is then determined, and a perpendicular is drawn to the right from this point (on the y-axis of the graph) to cut the cumulative frequency curve. The value at which the cumulative frequency curve intersects the x-axis is the median.
- The less than and more than ogive curve method simultaneously presents the data in the form of “less than” and “more than” ogives. The median value is calculated by superimposing the two ogives on top of each other. Make a mark at the intersection of the ogive curves and draw a line perpendicular to that point on the x-axis. The median value on the x-axis would be the corresponding value.
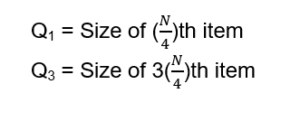
Quartiles under Measures of Central Tendency
A quartile is the end value of each of the four equal parts of a statistical series.
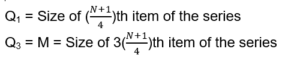
Calculation of Quartiles
- Individual And Discrete Series
- Frequency Distribution Series
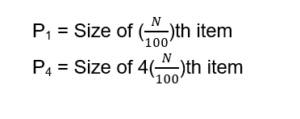
Percentiles
The term “percentiles” divides a series into 100 equal parts. The letter P denotes it.
It is estimated for different types of series as under;
- Individual and Discrete series
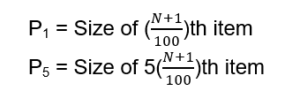
- Frequency Distribution Series
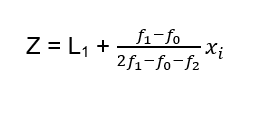
Mode
The mode is the value of the variable in a distribution that occurs most frequently.
“The mode may be regarded as the most typical of a series of values,” Croxton and Cowden state.
Calculation of Mode under Measures of Central Tendency
- Individual Series
There are two ways to calculate Mode in Individual series
- Inspection method
- Converting Individual series into discrete series
Discrete Series
There are two ways to calculate the Mode of discrete series
- Inspection method; Inspection can determine the mode if; The frequencies are consistent and uniform, The item with the highest frequency is the one and only one.
The modal value in this scenario would be the value that corresponds to the highest frequency.
- Grouping Method; Mode need not always be the value that occurs the most frequently or has the highest frequency if the frequency distribution is irregular and heterogeneous. In such instances, the mode is typically obtained through the Grouping Method.
Two tables have been prepared to determine the modal value based on the grouping method:
- Table for Grouping: Six columns contain groupings of frequencies in this first table.
- Table of Analysis: Frequency or value occurrences in various groupings are written and added to this second table. The value that occurs in the greatest number of groupings is the modal value.
Steps in the Grouping Method
Make a table with six columns and a column for various X values.
Column 1: Using the information in the question, compare the frequencies to various values of X;
2nd Column: The frequencies are grouped in twos, starting at the top. Determine their totals and mark the highest.
3rd Column: Beginning with the second frequency, group the frequencies in pairs (the first frequency is not included). Determine their total and mark the highest;
4th Column: The frequencies are grouped in threes, starting at the top. Determine their totals and mark the highest;
5th Column: It is not necessary to include the first frequency in this grouping of three frequencies. Determine their total and mark the highest.
6th Column: Frequencies are grouped in threes starting with the third (the first and second frequencies are not included). Mark the highest total after determining their total.
The mode is determined by identifying and analysing the highest frequency total in each of the six columns in the Analysis Table.
- Frequency Distribution Series
The exact value of the mode is calculated by the formula given below;
Mode’s advantages
- A common and easy way to measure central tendency.
- A histogram can be used to locate it graphically.
- Lower marginal value impact.
- No need to be familiar with the entire series.
- It is the value in the given series that is closest to reality.
- Extreme values have less of an impact on it.
Disadvantages of Mode under Measures of Central Tendency
- It is a hazy measurement.
- It cannot be dealt with algebraically.
- The process of grouping is difficult.
- Not all observations are taken into account.
- It is challenging to calculate the tri-modal and bimodal series.
- The series’ individual items do not determine its value.
- It is difficult to determine the modal value if the items are identical.
Mode’s graphic representation
Make a histogram using the data provided. Determine which rectangle has the highest height. The modal class will be held here. Draw two lines, one connecting the modal class’s top right point with the rectangle’s top right point. The other connects the post-modal class’s top-left point with the modal class’s top-left point. Draw a line perpendicular to the horizontal axis, or x-axis, from where these two diagonal lines meet. The mode value is found at the intersection of this line and the x-axis.
Relative Position of Mean, Mode, and Median under Measures of Central Tendency
Let’s express
Mean as Me
Median as Mi
Mode as Mo
The relationship between the three is expressed as follows;
Me>Mi>Mo Or Me<Mi<Mo
That means, Mode= 3 Median – 2 Mode
Therefore, the Median always falls between the Mean and Mode.
Conclusion
Measures of Central Tendency class 11 notes give a general and specific understanding of the concept. These notes are essential for reviewing and studying class material for better comprehension and exam preparation. Using these notes, which are effective and concise, you can save time, energy, and confusion that frequently results from attempting to make sense of unorganized, overwhelming, inadequate, or wordy notes. These notes can be very helpful when making outlines and studying.