Organisation of data class 11 notes are presented in this post for easy access to the students. By taking these notes, you can stay active and engaged throughout your reading, revision, and lectures. They also help with clear thinking and understanding. Choose the most important ideas to focus on. These notes provide a useful record of important information and its sources. You’ll be able to recall better what you heard with these notes.
Organisation of data class 11
The term “organisation of data” refers to the arrangement of facts and figures in such a way that it is possible to compare a large amount of similar data and conduct additional analysis.
Concept of Variable
- A variable is a characteristic or phenomenon that can be measured and changes in value over time.
- For example; Price, Age, Weight, Height, Wages, etc.
- The variable can be discrete or continuous.
- Discrete variables are those that rise with jumps or complete numbers. It takes the exact value into consideration. For example; Number of workers in a firm, number of students in a class.
Table 1; Number of children in 30 families in a building
| Number of children | Number of families |
| 0 | 6 |
| 1 | 9 |
| 2 | 11 |
| 3 | 4 |
- Variables that assume a range of values or increase continuously or fractionally are referred to as continuous variables. It takes all possible values be it fractional or integral into account. For example; Height and weight of individuals.
Table 2; Height of 40 students of class 10th
| Height (in cm) | Number of students |
| 140-145 | 5 |
| 146-150 | 11 |
| 150-155 | 9 |
| 156-160 | 5 |
| 160-165 | 10 |
| Total | 40 |
- Raw Data- Raw data refers to a mass of data in its most basic form.
Frequency under Organisation of data class 11
Frequency is the number of times a given value is repeated in any distribution.
For example; 10 students have got 70 marks
5 students have got 75 marks.
Types of statistical series
Statistical Series is the arrangement of classified data in some logical order, such as according to size, time of occurrence, or other measurable or non-measurable characteristics.
- Statistical series are set up to present the data that has been collected and categorised in an orderly manner.
- A statistical series, for instance, is one in which the data pertaining to the grades of 35 students in a class are organised in a systematic manner.
There are two types of statistical series;
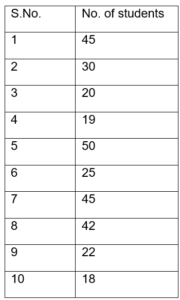
- Individual series- Individual series are those in which each item is listed separately.
- For example; Marks of 10 students of class 12th in Maths are given individually.
There are two types of Individual series
- Unorganised Individual series; It is an unarranged lot of raw data.
- Organised Individual series; It is an arranged group of raw data.
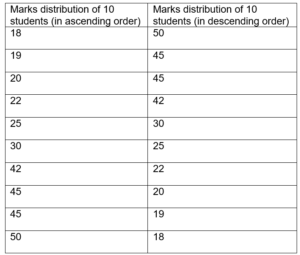
- Frequency series- Frequency series can be presented in one of two ways:
- According to serial numbers
- In ascending or descending order of the data.
A comprehensive method for categorising quantitative variable raw data is frequency distribution. It demonstrates the distribution of the various values of a variable across various classes and the frequencies of those classes.
- The middle value of a class is known as the class midpoint or class mark. It can be determined in the following manner as it lies halfway between a class’s upper and lower limits.
Class midpoint= Upper class limit + Lower class limit / 2
- Frequency of classes: It refers to the number of values that belong to a given class.
- The class width is the difference between the upper-class limit and the lower-class limit. Class limits have two ends: the upper-class limit and the lower-class limit. The lower-class limit refers to the lowest value, while Upper-Class Limit refers to the highest value.
- The classes are formed in such a way that the upper-class limit of one class equals the lower-class limit of the next class using the exclusive method. E.g 0-10, 10-20.
- There is a flaw in the classification of data as a frequency distribution. While doing so, it provides a concise and easy-to-understand summary of the raw data. It does not display the raw data-specific details. Therefore, classifying raw data results in the loss of information.
- The transformation of raw data into statistical series is necessary for data classification.
Frequency series can be of two types:
- Discrete series and frequency array- In discrete series, the data are presented in such a way that the precise measurements of the items can be seen. There are neither class intervals nor a single item in this series.
- Frequency Distribution series- The series in which items cannot be precisely measured is called the frequency distribution. The class interval is the range of values that the items take into account and fall within.
Continuous series, series with class intervals, and series of grouped data are other names for frequency distribution.
Types of Frequency Distribution under Organisation of data class 11
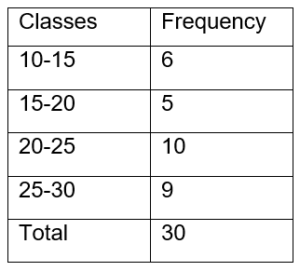
- Exclusive Series- The series in which each class interval excludes items that correspond to its upper limit is an example of an exclusive series.
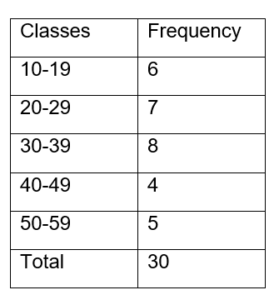
2. Inclusive series- An inclusive series is one in which every item up to its upper limit is included.
- The inclusive method does not exclude the upper-class limit in a class interval, unlike the exclusive method. A class includes members of the upper class. As a result, both class limits are components of class intervals, such as 0-9 and 10-19.
1.Open End Series- A series with an open end is one in which the lower limit of the first class interval and the upper limit of the last class interval are missing, such as below – 5, 20 and above.
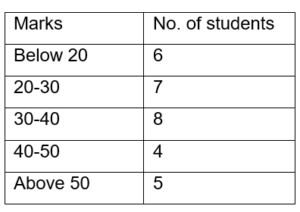
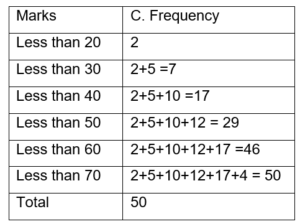
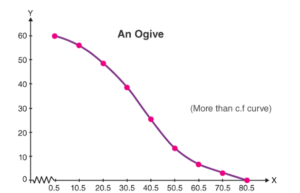
2. Cumulative Frequency series- A cumulative frequency series is one in which the frequencies that correspond to each class interval in the series are continuously added.
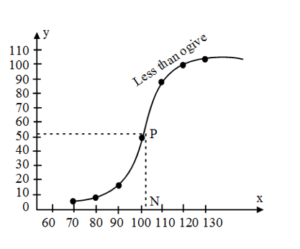
- Less than cumulative frequency: Each class interval’s frequencies are added one at a time.
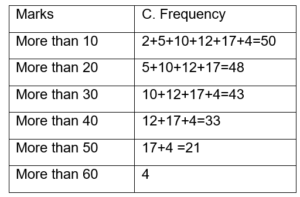
- More Than Cumulative frequency- Finding the cumulative totals of frequencies from the variable’s highest to lowest value yields more than the cumulative frequency.
- Tally Marking: The score is kept and counted using tally marks and graphs. The value 1 is indicated by the character “|.” Before the discovery of numbers, it was challenging to track individuals’ possessions. For instance, humans used to keep goats and cows for their use; Consequently, if the number was large, keeping track of it was difficult. Tally marks were helpful at the time.
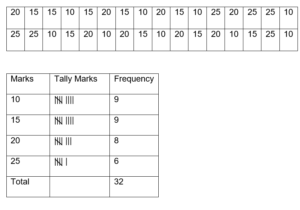
- The unary numbering system is how tally marks are defined. It is a type of number that is used to count. In general, tally marks are written as a group or set of five lines. Each fifth line runs diagonally over the previous four vertical lines, i.e. from the top of the first line to the bottom of the fourth line. The first four lines are drawn vertically.
This series can be transformed into a cumulative frequency series in two ways.
- Cumulative frequencies can be expressed using the upper-class limits of the class intervals.
- Lower class limits of the class intervals can be used as the basis for expressing cumulative frequencies.
- Mid-Value Frequency Series- We only have mid-values of the class intervals and the corresponding frequencies in the mid-value frequency series.
- Univariate Distribution- The term “univariate distribution” refers to the frequency distribution of a single variable. It is a one-way frequency.
- Bivariate Distribution- The frequency distribution of two variables is known as a bivariate distribution. It is a two-way frequency.
Conclusion
Organisation of data class 11 notes give a wholesome definition of organising data and various related concepts. You can stay active and engaged throughout your reading, revision, and lectures by taking these notes. Additionally, they aid in clear thinking and comprehension. Selectively identify important ideas. A useful record of important information and its sources can be found in these notes. These notes will help you remember what you heard better.