Income Determination And Multiplier Class 12 Notes
National Income Determination and investment Multiplier Class 12 Notes. In this blog, we have made detailed study notes for this class 12th Economics chapter National Income Determination and investment Multiplier class 12, to help you learn and prepare for your upcoming Term II exams!
| Subject | Economics |
| Chapter | Income Determination And Multiplier |
| Category | CBSE Economics Class 12 Notes |
Income Determination And Investment Multiplier Class 12 Notes
- Equilibrium – meaning
- Aggregate demand-aggregate supply approach (ad-as approach)
- Saving-investment (s-i approach)
- Investment multiplier
- The maximum and minimum value of the multiplier
- Working of investment multiplier
Meaning of Equilibrium
Equilibrium is a point of rest. An economy is said to be in equilibrium when the aggregate demand is equal to aggregate supply during a period of time.
Approaches for Determination of Equilibrium
As per KEYNES, there are TWO APPROACHES to determine the level of income and employment in an economy: –
- AD-AS approach.
- S-I approach.
Assumptions of equilibrium
- The equilibrium output is determined in the two-sector model, only households and firms are assumed to be present and there is no government and foreign sector.
- The price level is assumed to remain constant.
- Equilibrium output is determined in the short run.
- 4. Investment expenditure is assumed to be autonomous.
AGGREGATE DEMAND-AGGREGATE SUPPLY APPROACH (AD-AS Approach)
“As per the Keynesian theory, the equilibrium level of income in an economy is determined when aggregate demand is equal to the aggregate supply.”
Where AD = C+I
AS = Total Output
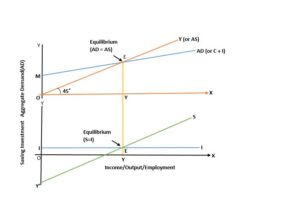
AD- AS APPROACH SCHEDULE AND DIAGRAM
|
INCOME (Y) |
CONSUMPTION
(C) |
SAVING
(S) |
INVESTMENT
(I) |
AD
(C+I) |
AS (C+S) |
| 0 | 50 | -50 | 50 | 100 | 0 |
| 50 | 75 | -25 | 50 | 125 | 50 |
| 100 | 100 | 0 | 50 | 150 | 100 |
| 150 | 125 | 50 | 175 | 150 | |
| 200 | 150 | 50 | 50 | 200 | 200 |
| 250 | 175 | 75 | 50 | 225 | 250 |
| 300 | 200 | 100 | 50 | 250 | 300 |

Observations of aggregate demand-aggregate supply
- AD(C+I) comprises Consumption expenditure, which varies with the level of income, and Investment expenditure which is assumed to be autonomous, i.e. independent of the level of income.
- AS (C+S) comprises Consumption expenditure and Saving. It is the total output of goods and services.
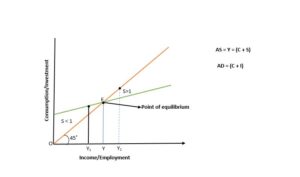
- The economy is in equilibrium at point E as at this point AD = AS.
- The equilibrium level of income is 200, When AD = AS.
- This is called the situation of effective demand. Effective demand refers to that level of AD that becomes effective because it is equal to AS.
Case 1: When AD > AS (Income below ₹200 crores).
It implies that households and firms are planning to purchase more than what producers are planning to supply. It is a situation of shortage of goods and services, to meet shortage producers will start selling from planned stock and there will be an unplanned fall in stock. In this situation, the actual stock will be less than the planned stock. To retain planned stock, producers will plan to increase production by increasing investment. It will lead to an increase in income, output, and employment due to investment multipliers. This process will continue till AD =AS at rupees 200 crores.
Case 2: When AD < AS (Income above ₹200 crores)
It implies that households and firms are planning to purchase less than what producers are planning to supply. It is a situation of a surplus of goods and services, to meet surplus producers will start saving from planned stock and there will be an unplanned increase in stock. In this situation, the actual stock will be more than the planned stock. To retain planned stock producers will plan to decrease production by decreasing investment. It will lead to a decrease in income, output, and employment due to investment multipliers. This will continue till AD= As at ₹200 crores.
SAVING-INVESTMENT (S-I approach)
“According to this approach, the equilibrium level of income is determined at a level, where Planned Saving (S) is equal to Planned Investment (I).”
S-I APPROACH SCHEDULE AND DIAGRAM
|
INCOME (Y) |
CONSUMPTION
(C) |
INVESTMENT
(I) |
SAVING (S) |
| 0 | 50 | 50 | -50 |
| 50 | 75 | 50 | -25 |
| 100 | 100 | 50 | 00 |
| 150 | 125 | 50 | 25 |
| 200 | 150 | 50 | 50 |
| 250 | 175 | 50 | 75 |
| 300 | 200 | 50 | 100 |

Observations of saving-investment
- Savings Curve (S) is upward sloping as it represents the positive relationship with income, as saving rises when income increases.
- Investment Curve (I) is parallel to the axis as the investment is autonomous, it is independent of change in income.
- The economy is in equilibrium at the point Where Saving is equal to Investment.
- The equilibrium level of income is 200 as at this point planned saving is equal to planned investment.
Case 1: When I > S (Income below 200 cr.)
It implies that firms are planning to invest more than what households are planning to save. It is a situation of shortage of goods and services, to meet the shortage of goods and services producers will start selling from planned stock, and there will be an unplanned fall in stock. In this situation, the stock will be less than the planned stock. To retain planned stock, firms will plan to increase production by increasing investment. It will lead to an increase in income, output, and employment due to investment multipliers. Since the increase in income is more than an increase in investment which leads to an increase in savings more than an increase in investment. This process will continue until planned S=Planned I at ₹200 crores.
Case 2: When I < S (Income above ₹200 crores)
It implies that firms are planning to invest less than what households are planning to save. It is a situation of a surplus of goods and services, to meet the surplus of goods and services producers will start storing from planned stock and there will be an unplanned increase in stock. In this situation, the actual stock will be more than the planned stock. To retain planned stock forms will plan to decrease savings by decreasing investment. It will lead to a decrease in income, output, and employment due to investment multipliers. Since the decrease in income is more than a decrease in investment which leads to decreasing saving more than a decrease in investment. This process will continue until planned S=Planned I at ₹200 crores.
INVESTMENT MULTIPLIER
“Multiplier is the ratio of increase in national income due to an increase in investment.”
K=∆Y/∆I
Where K = Multiplier
∆Y= Change in National Income
∆I = Change in Investment
Algebraic RELATION WITH MPC
K=∆Y/∆I
Since Y=C+I
∆Y=∆C+∆I
Or
∆I=∆Y-∆C
K=∆Y/∆Y-∆C
Dividing both sides by ∆Y, we get
K=1/1-MPC
There is a direct relationship between K and MPC.
- Higher MPC means people are consuming a large proportion of their increased income. The value of MPC will be more.
- Lower MPC means people are consuming a small proportion of their increased income. The value of MPC will be less.
In terms of MPS the Multiplier will be:
K=1/MPS
Maximum and Minimum value of Multiplier
- The maximum value of Multiplier is infinity.
- The minimum value of Multiplier is 1.
Working of Investment Multiplier
The working of an Investment Multiplier is based on the assumption that the expenditure of one person is the income of another.
When an additional investment is done in the economy that will increase the National Income Determination and Multiplier many times.
The process starts with an addition in investment.
Suppose the government invested rupees 1000 crore for construction of Highway and MPC is 0.8.
| Round | ∆I | ∆Y | ∆C | ∆S |
| 1 | 1000 | 1000 | 800 | 200 |
| 2 | 800 | 640 | 160 | |
| 3 | 640 | 512 | 128 | |
| … | ||||
| Total | 1000 | 5000 | 4000 | 1000 |
Round 1: Fresh investment of rupees 1000 crore made by the government increases the income of the person engaged in the construction of the Highway.
Since MPC is 0.8, they will spend 800 crores on consumption, and the remaining is saved. At the end of the round increase in income is equal to rupees 1000 crore.
Round 2: Rupees 800 crore spent on consumption becomes the income of producers engaged in the production of goods and services. They will spend rupees 640 crores on consumption and the remaining is saved. The increase in income in this round is equal to rupees 800 crore and the total increase in income in this round is rupees 1800 crore.
This process will continue until ∆C=0 or ∆Y=∆S.
In this process total increase in National Income Determination and Multiplier is ₹5000 cr. As additional investment was made of ₹1000 cr.
K=∆Y/∆I
K= 5000/1000
K=5
CBSE Class 12 Economics Notes Term II Syllabus
Part A: Introductory Macroeconomics
- Circular Flow of Income Class 12 Notes
- Basic Concepts of Macroeconomics Class 12 Notes
- National Income and Related Aggregates Class 12 Notes – 10 Mark
- National Income and Related Aggregates Class 12 Numericals
- Determination of Income and Employment Class 12 Notes
- Aggregate Demand and Its Related Concepts Class 12 Notes
- Excess Demand and Deficit Demand Class 12 Notes
- National Income Determination and Investment Multiplier Class 12 Notes
Part B: Indian Economic Development
Current challenges facing Indian Economy – 12 Marks
Development Experience of India – A Comparison with Neighbours – 6 Marks